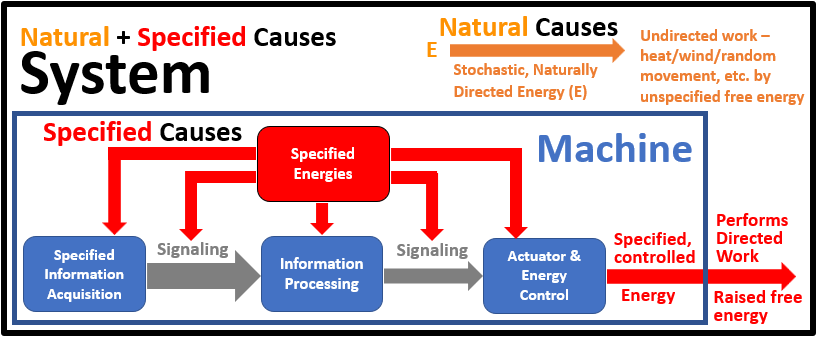
Earth’s Temperature Mechanism – It’s not Greenhouse! #2
Purpose
Note: This post is an update. However, it is dwarfed by the Non-Governmental International Panel on Climate Change, previously overlooked, which I suggest reviewing. If one reads IPCC (the UN Intergovernmental Panel on Climate Change) reports, then the Non-Governmental document is a must-read.
The purpose of this document is to show, in layman’s terms, that anthropogenic (human-caused) Global Warming (AGW) caused by carbon dioxide (CO2) is false. This false belief is leading to misguided policy decisions, the misuse of resources and attention, divisiveness, and a lower standard of living.
The agency that acts as the climate change authority and official advisory agency for the United Nations is the Intergovernmental Panel on Climate Change (IPCC). The IPCC uses a flawed model for the removal of heat from the Earth. It is therefore incapable of determining the correlation between the level of CO2 in the atmosphere and the Earth’s surface temperature, and their claim is patently false.
Also, the AWG proponent’s claim that there is a scientific consensus that CO2 causes global warming is false and is debunked.
The goal is to assemble and explain the issues involved in terms that anyone can understand and use to “spread the word” to small groups, such as service clubs like Rotary, Kiwanis, and Lions, as well as businesses, churches, schools, and other organizations. I believe that a “bottom-up” group of “activists” volunteers is needed to overcome the false narrative that has been promulgated. Hopefully, these materials are used for this purpose.
The Truth Regarding CO2 Causing Climate Threat
The “Consensus Claim”
Very likely, most people are not interested in climate science, so they are satisfied with what scientists claim. Hearing that there is a consensus of scientists that human-generated CO2 poses an existential threat is all they need to know. This makes promulgation of the truth of this matter particularly important because of the huge misuse of all manner of resources. The first sentence in the book Why Scientists Disagree About Global Warming says:1
“Probably the most widely repeated claim is the debate over global warming is the “97 percent of scientists agree” that climate change is man made and dangerous. This claim is not only false, but its presence in the debate is an insult to science.”
The title of the first chapter of this book is entitled “No Consensus.” Still, if you read it, which I recommend you do, you will find that there is no consensus. The claim we all hear is that there is a scientific consensus that human-created CO2 emissions pose an existential threat to the Earth’s temperature. Climate is very complex and impossible to predict because it depends upon factors we cannot control or predict, such as the sun’s radiation, the earth’s orbit, cosmic radiation, volcanic activity, the earth’s tilt axis, the magnetic shield, etc. However, the IPCC has developed computer modeling based on the idea that the Earth’s excess heat is removed from the Earth’s surface by radiation, and CO2 inhibits its escape to space because of its “greenhouse gas” property. The approach used is not scientific; it is based on “causal forcing functions,” using collected, short-term data. Correlation does not prove causation; it can be an effect, and there is one that is explained later. Therefore, the entire IPCC methodology is flawed and lacks scientific validity.
The 97 percent AWG consensus came from this:2
In 2009, a paper by Maggie Kendall Zimmerman, at the time a student at the University of Illinois, and her master’s thesis advisor Peter Doran was published in EOS, They claimed “97% of climate scientists agree” that mean global temperatures have risen since before the 1800s and that humans are a significant contributing factor (Doran and Zimmerrman, 2009). This study, too, has been debunked.
The researchers sent a two-minute online survey to 10,257 earth scientists working for universities and government research agencies, generating responses from 3,246 people. Solomon, L. 2008.3 observed, “the two researchers started by altogether excluding from their survey the thousands of scientists most likely to think that the Sun or planetary movements, might have something to do with climate on Earth – out were the solar scientists, spaced scientists, cosmologists, physicists, meteorologists, and astronomers. That left the 10,257 scientists in disciplines like geology, oceanography, paleontology, and geochemistry that were somehow deemed more worthy of being included in the consensus. The two researchers also decided that scientific accoplishment shourld not be a factor in who could answer… those surveyed were determined by their place of employment (an academic or a a governmental institution). Neither was academic qualification a factor – about 1,000 of those survey did not have a PhD, some didn’t even have a master’s diploma.” Only 5 percent of the respondents self-identified as climate scientists.
Even worse, than the sample size, the bias shown in its selection, and the low response rate, though, it is the irrelevance of the questions asked in the survey to the debate taking place about climate change. The survey asked two questions:
“Q1. When compared with pre 1800s levels, do you think that mean global temperatures have generally risen, fallen or remained relatively constant?
Q2. And Do you think human activity is a significant contributing factor in changing mean global temperatures?
Overall, 90% of respondents answered “risen” to question 1 and and 82 percent answered “yes” to question 2. The authors get their fraudulent “97% percent of climate scientist believe” sound bite by focusing on only 79 scientists who responded and “listed climate science as their area of expertise and who also have published more that 90 percent of the recent peer reviewed papers on the subject of climate change.”
The Global Warming Petition Project
However, a real petition project was conducted some years ago, with the following statement:
We urge the United States government to reject the global warming agreement that was written in Kyoto, Japan in December, 1997, and any other similar proposals. The proposed limits on greenhouse gases would harm the environment, hinder the advance of science and technology, and damage the health and welfare of mankind.
There is no convincing scientific evidence that human release of carbon dioxide, methane or other greenhouse gases is causing or will, in the foreseeable future, cause catastrophic heating of the Earth’s atmosphere and disruption of the Earth’s climate. Moreover, there is substantial scientific evidence that increases in atmospheric carbon dioxide produce many beneficial effects upon the natural plant and animal environments of the Earth.
This letter accompanied the petition:
|
Enclosed is a twelve-page review of information on the subject of “global warming,” a petition in the form of a reply card, and a return envelope. Please consider these materials carefully. The United States is very close to adopting an international agreement that would ration the use of energy and of technologies that depend upon coal, oil, and natural gas and some other organic compounds. This treaty is, in our opinion, based upon flawed ideas. Research data on climate change do not show that human use of hydrocarbons is harmful. To the contrary, there is good evidence that increased atmospheric carbon dioxide is environmentally helpful. The proposed agreement would have very negative effects upon the technology of nations throughout the world, especially those that are currently attempting to lift from poverty and provide opportunities to the over 4 billion people in technologically underdeveloped countries. It is especially important for America to hear from its citizens who have the training necessary to evaluate the relevant data and offer sound advice. We urge you to sign and return the petition card. If you would like more cards for use by your colleagues, these will be sent. Frederick Seitz There were over 30,000 signatories, listed here so that anyone can contact them. |
The Greenhouse Misnomer
Before discussing science, one needs to understand the misleading use of the term greenhouse when applied to atmospheric science. A greenhouse traps heat by allowing radiation in and out through the glass, but the glass traps heat by disallowing conduction and convection, By contrast, the primary method of heat transfer from the surface of the earth to the top of the troposphere (the lowest layer of atmosphere that ranges fro approximately 6 to 10 miles) is convection, the movement of air and water in its various states as controlled by the Physics Adiabatic Gas Law as explained later. Most of the heat leaving the Earth’s surface is directed to the troposphere through conduction and evaporation of water, rather than radiation. A more suitable analogous term would be “heat pipe,” explained later, as it better fits the actual heat transfer mechanism through the troposphere than a radiation model. However, we are “stuck” with the “greenhouse gas” terminology because the public at large has been convinced of the validity of radiation as the dominant method of heat transfer from the Earth’s surface. And the greenhouse effect of water vapor does indeed force the weather action (work) to physically move the heat to the upper layers of the atmosphere.
H2O is the Dominant “Green House Gas” (98%), CO2 is Minor (2%)4
I’ve always felt that the CO2-driven AGW claims were wrong because it is evident from personal experience that water vapor is the dominant “greenhouse gas.” I grew up in a relatively high-elevation (3k to 6k feet) and dry (13 inches of rain/year) area. During the summer, temperatures often reach 100 degrees F during the day and drop to near freezing at night. Then we briefly lived in Minnesota, where the summers were hot and humid. It would stay hot during the night, cooling just a few degrees. I had not appreciated the heat-trapping effect of humidity in the air until experiencing this contrast in regional climates.
If CO2 were the dominant greenhouse gas, it would trap the heat and keep the temperature warm during clear, dry nights. Therefore, the prevalent greenhouse gas is water vapor, which causes the humidity that traps the heat, not CO2. Its effect should be most pronounced in deserts, where there is abundant sunshine and minimal humidity. Google “desert,” and you can find statements such as this: ”…deserts.. are characterized by considerable diurnal thermal excursions (for example the temperature during the day exceeds 122 °F (50 °C) whereas during the night it goes down to a few degrees above zero)”5
Here is another quote:6”…temperatures in the Sahara can plummet once the sun sets, from an average high of 100 degrees Fahrenheit (38 degrees Celsius) during the day to an average low of 25 degrees Fahrenheit (minus 4 degrees Celsius) during the night, according to NASA.”
As a side note, the IPCC Commission, the agency that makes the AGW predictions, uses a method of predicting temperature changes by using greenhouse gas “forcing factors.”7 The greenhouse gases they initally listed as global warming radiation forcing factors are carbon dioxide (CO2), methane (CH4), nitrous oxide (N2O), and carbon tetrafluoride (CF4). Missing is water vapor, H2O. As we’ll show later, H2O is, by over an order of magnitude, the totally dominant greenhouse gas!
Ignoring H2O and substituting the pseudo-science of “forcing factors” is how the IPCC avoids using real science, like the Gas Law and the Adiabatic Theory, to model the climate mechanisms. “Forcing Factors” have no quantitative relationship to a physics model for almost any system, particularly for something as complex as weather and climate. It is just a means to pick numbers that produce the results they seek. There is no way IPCC using credible science could conclude that CO2 drives the earth’s surface temperature because it doesn’t!
The Science
We understand the fundamental mechanisms that determine the Earth’s temperature, but because of the complexity and the massive number of interacting parts, we cannot predict climate change. For example, we can analytically determine the average temperature and pressure of our lower layer of atmosphere (troposphere) and have verified the results here on Earth, as well as Venus and Mars by direct measurement, as shown in Figure 1 below. These results are detailed in a great book,8 G. Chilingar, “The Evolution of the Earth’s Climate,” which provides the scientific explanation of the adiabatic gas physics and the resulting math.
The temperature at Earth’s surface must be enough to support the weight of the atmosphere above it, according to the gas law. The change in pressure and temperature needs to follow this gas law all the way to the top of the atmosphere, but the math of the gas law does not support this for a “static” atmosphere. The atmosphere must do work to comply with the laws of physics at all points, and it does. We call this weather. Weather, involving air movement, state changes of H2O, cloud formation, rain, and snow, is the dominant means by which heat is transferred from Earth’s surface to the top of the troposphere and beyond, where most heat radiates into space. Climate involves ocean currents and temperature variations, as well as topical features such as mountains, deserts, and ice, and seasonal effects like hurricanes, monsoons, and wind patterns. From a physics point of view, energy balance requires physical work to be performed because heat transfer alone does not get the job done.
Temperature History
The AGW advocates act as if climate history started at the beginning of the industrial revolution when recording temperature and CO2 averages began. This period represents 0.00004% of the time since multicelled life began, 520 million years ago. And instead of “record highs,” we can see that we are in a period near record lows both in temperature and CO2 level. This deception is dangerous because it misuses our attention, efforts, resources and hides unknown dangers.

Figure 1. Courtesy of “The E-Book.” Figure 23, Page 82. I added the two red horizontal lines to highlight that we are at historic low levels of both temperature and CO2 level. I also added the sloping red line to highlight the temperature-lowering trend for the past 50 million years, another concern discussed later. This line curves at the end to compensate for the non-linear time scale.
If someone can see a correlation between CO2 levels and temperature, they have a better imagination than I. Why are we considering our historically low temperature and CO2 levels, as shown by the horizontal red lines, an existential threat for being too high? It seems more plausible that it is too low. Isn’t the lowering temperature trend highlighted by the downward-sloping red line a concern? What is the cause of this trend?
Extinctions
The Cambrian period includes what is known as the Cambrian Explosion,11 the point in time when almost all phyla alive today, including the phylum Chordata which includes humans, appears.
Note the dip in temperature during the Ordovician-Silurian period. As stated in Wikipedia:”
“The Ordovician–Silurian extinction events may have been caused by an ice age that occurred at the end of the Ordovician period, due to the expansion of the first terrestrial plants,[22] as the end of the Late Ordovician was one of the coldest times in the last 600 million years of Earth’s history.”
The subsequent dip in temperature was during the Carboniferous period. Again, Wikipedia:
“Before the end of the Carboniferous Period, an extinction event occurred. On land this event is referred to as the Carboniferous Rainforest Collapse (CRC).[11] Vast tropical rainforests collapsed suddenly as the climate changed from hot and humid to cool and arid. This was likely caused by intense glaciation and a drop in sea levels.” [32]
Another temperature dip occurred at the end of the Jurassic period. Again, Wikipedia:
“The preceding end-Triassic extinction would result in the decline of Peltaspermaceae seed ferns, with Lepidopteris perisisting into the Early Jurassic in Patagonia.[54] At the Triassic-Jurassic boundary in Greenland, the sporomorph diversity suggests a complete floral turnover.[55] An analysis of macrofossil floral communities in Europe suggests no extinction over the Triassic-Jurassic boundary, and that changes were mainly due to local ecological succession“.[56]
The temperature “dipped” to a level about 3 degrees C higher than our temperature today, resulting in a minor extinction.
The point is that extinctions occurred when the temperature was even near as low as our temperature today. Some say we are in the period of the 6th major extinction.
- AGW proponents ignore but do not dispute the evidence of our past climate that shows the earth to be near record lows both in temperature and CO2 levels.
- There is no historical correlation between CO2 level and temperature.
- We seem to be on a downward temperature trend that could be a long-term existential threat.
- Other periods of temperature “dips” as we are now in, resulted in extinctions.
Reasons AGW Claims are Wrong:
- Historical records provide reasons to be concerned not by too high temperatures and CO2 levels, but being too low.
- History shows that there is absolutely no correlation between CO2 levels and temperature.
The CO2 Lags (and Therefore Not the Cause of) Air Temperature
As it turns out, there is a correlation between CO2 and temperature. But it isn’t the atmospheric temperature; it is the temperature of the oceans. The reason is well understood. The Antarctica data that shows the recent ice age cycles is shown here as Figure 2, again from the eBook.

This data shows the CO2 levels follow the atmospheric temperature by ~ 400-800 years.12 If CO2 were the cause of temperature rise, then the CO2 level would lead. As previously noted, the oceans are the primary sink for CO2.13 The saturation level lowers with temperature, causing CO2 outgassing when the ocean temperature rises. The ocean’s temperature rises and falls more slowly than the air temperature by hundreds of years, causing the air temperature to lead to the CO2 concentration in the air. Currently, the CO2 level serves as an indirect indicator of the average ocean temperature. Unknown to me, other research has verified this relationship, to the chagrin of AGW advocates.14
AGW “experts” explain the cause of the CO2 lag, the most common is a positive feedback mechanism. This explanation cannot work whether the feedback is positive or negative due to the difference in forward and feedback loop time scales; one is days, the other is hundreds of years. Imagine you have a car whose steering wheel takes a year to turn the wheels in response to your steering command. I am a control engineer; this is a valid analogy. Other arguments given are equally nonsensical. Other AGW proponents claim they don’t understand why CO2 lags behind temperature, but this does not alter their belief in AGW. The causal mechanism (ocean temperature-dependent CO2 sink) is not a mystery.
The Ebook cites speculation that the interglacial cycles could be associated with the Solar System’s journey around the Milky Way, a 225-250 million year journey. Here is a quote from page 122:
“On geological time scales, cold periods, with supposed cooling of several degrees including glaciations or at least widely expanding glaciers return every 130 to 150 (say 138 million years), and could correspond to the passage of the solar system in one of the arms of the galaxy (Shaviv, 2002, 2003), arm where the flux of cosmic rays is stronger than between the arms (Shaviv and Veizer, 2003), (Veizer, 2005), and also at the passage of the solar system in the plane of the galaxy, or even to “near” supernova explosions.”
The Ebook also cites studies to determine when interglacial cycles will start.15 These studies suggest that the “decision” to start the next interglacial was made to the affirmative 1500 years ago, and it will begin 1500 to 4500 years from now.
- The atmospheric CO2 level lags the atmospheric air temperature, therefore cannot be the cause of global warming.
- Some AGW proponents have proposed technically impossible (being polite) explanations, others just admit they cannot explain it.
- There is reason to think the interglacials are associated with the solar system’s rotation within the Milky Way, and that we can expect the next interglacial to start 1500 – 4500 years from now.
Reasons AGW Claims are Wrong:
- The atmospheric CO2 level lags the atmospheric air temperature, therefore cannot be the cause of global warming.
The “Greenhouse Gas” Properties of CO2 and H2O
The figure below graphically shows why water vapor is the dominate “greenhouse gas” compared to Carbon Dioxide. Because there are far more orbital possibilities for electrons orbiting around water molecules compared to carbon dioxide,

Figure 3. Courtesy of “The Rational Climate E-Book,” Figure 9, page 51. I added the “Atmospheric” or “Water Vapor” Window to illustrate the only frequency range the IR radiation can bypass the adiabatic troposphere, and the “CO2 Shade” the only frequency range CO2 absorbs IR (~19-23THz), coupled with the low concentration, makes CO2 an “almost nonexistent” “greenhouse” gas.
Figure 3 shows the optical thickness of the water vapor and CO2 concentrations found in the air (the blue and red lines). One can think of optical thickness as the relative IR opaqueness or the gas’s relative IR absorbability.
The yellow and black lines represent the infrared radiation amplitude from the earth’s surface. Note that the amplitudes are logarithmic; the scale covers a range of 1:10,000.
With a bit of assistance from CO2 outside the 18-22 THz frequency range, the water vapor essentially blocks all IR radiation from the earth towards the cosmos. As quoted from the Ebook9,16
“These are remarkable numbers providing reliable orders of magnitude showing that just 17 meters of air in the tropical zone or 280 meters in the temperate zone during winter (lower content of H20 vapor) are the thickness of the slice of atmosphere that will stop 80% of the radiative emissions originating from the ground.”
The only IR that reaches the cosmos directly from the earth’s surface is through the 18-22 THz frequency range and is called the “water vapor window,” shown in Figure 3, and amounts to only 9% of the heat energy transferred through the troposphere.
The only IR radiation CO2 blocks is identified as the “CO2 Shade” in Figure 3. This singular CO2 absorption frequency range is blocking only a small portion of the IR radiation from the earth’s surface (yellow and black lines on Figure 3), and the concentration level is so low (400ppm) that it is a “bit player” as a greenhouse gas. This inability of CO2 to trap only a tiny portion of the IR spectrum allows surface heat to escape when humidity is very low. This is the reason that after a hot day in a desert, it will be cool to cold in the morning. H2O is the greenhouse gas that captures 98% of the heat from surface IR radiation. And even if the AGW advocates’ theory about “radiation heat transfer” being the dominant mechanism of moving heat through the troposphere were true, higher levels of CO2 would have little effect on temperature.
One cannot overstate the heat absorption capability of H2O. It has been computed17 that “…a doubling of CO2 would lead to a decrease in the surface temperature by 2 thousandths of a degree.” Added CO2 decreases the temperature because its thermal conductivity is higher and can conduct or convey more heat than H2 and O218.
Since water vapor is already blocking the CO2 frequency range, the net effect of its addition is zero. This analogy is crude as it represents an approximate average over the face of the earth. And calculations presented later using real science estimates that doubling CO2 would lower the temperature by 2/1000 of a degree.
AGW advocates responded to the minor frequency range CO2 acting as a greenhouse gas by inventing an “amplification” theory.19 This report did not provide calculations, which is not surprising because they would cause tiny changes, as it applies to very little energy. Additionally, the temperature-evaporation-cloud cover feedback loop described later would mitigate this effect. However, the IPCC’s computer model still depends upon this “amplification” factor.
- CO2 is a trace “green house” gas in the atmosphere that blocks only a small portion of the earth’s IR radiation, about 2% compared to 98% by H2O.
- Doubling the amount of CO2 in the atmosphere has been computed to LOWER the temperature by 2/1000 degree C.
- AGW advocates wrongly treat “green house” gasses as being reflective in one direction, when in fact they are absorbative and re-radiate in all directions. And they ignore the minor role of CO2 as an IR “green house” gas.
Reasons AGW Claims are Wrong:
- CO2 (400ppm) is a small fraction of water vapor (15,000 ppm)20 and blocks IR in only a small frequency range of the IR emitted from the earth’s surface, and contributes almost nothing regarding surface temperature whether one believes the AWG models, or the physics, proven, adiabatic gas law model.
Sea Level Rise – The Real Story
NASA has accurate sea level data obtained from surface level measurements dating back 140 years (to 1880), and very accurate data from satellites for the last 50 years..

Anyone know how much 250 mm is? 254 is 10 inchs. Al Gore said in his Inconvenient Truth presentations that quote ”due to global warming, melting ice could release enough water to cause a 20 foot rise in sea level in the very near future.”
Holocene Climate
The Holocene is the name given to the last 11,700 years of earth’s history. This is the period since the end of the last major glacial epoch, or “ice age.” Since then, there have been small-scale climate shifts, notably the “Little Ice Age” between about 1200 and 1700 A.D. But in general, the Holocene has been a relatively warm period in between Ice ages.

Figure 6. Holocene Period Temperature related to causal mechanisms and effects.
One can see that the cries that we reaching record highs and the projected man-made climate change is an “existential threat” and “threatens our very existence”21 are not warranted based on Figure 6. This is particularly true considering that CO2 has little to do with earth’s temperature which is the point of this post. The main reason to include this data is to show that the claims that we are reaching “historic highs is nonsense. Such claims come from thinking that history started at the end of the mini ice age. If one thinks that history is important, we should be most concerned about an impending next ice age, which, as mentioned later, is calculated to start 1500 to 4000 years from now.
The Ebook Revelations
Photosynthesis and CO2 levels
The most troubling fact I learned from the Ebook was photosynthesis cannot take place at CO2 levels below 150 ppm. I added the red dashed line in Figure 2 at the 180 ppm level, which approximates the low CO2 level before coming out of each ice age cycle. 150 ppm is only 30 ppm lower than 180. Figure 1 shows the current CO2 low levels during our ice age cycles, are at the lowest level during the whole history of life. Our low CO2 level IS an existential threat if we go through another ice age cycle and the CO2 level is only 30 ppm lower.!!!
CO2 is essential to plant life, and plants are part of the food chain for all multicelled life. Plants are “starving” at CO2 levels below 285 ppm, but do much better at 800 ppm, and are at 100% at 1200 ppm and above.22 An extinction occurred during the Permian period 250 million years ago. This period was the only other time the CO2 level reached levels below 1000 ppm during life’s history. How can we be worried about rising CO2 levels rising above 400ppm??? Instead, shouldn’t we be trying to figure out how to get it to the 800 to 2000 ppm range? There is another reason to believe this that I’ll get to later.
Summary:
- The CO2 levels at the peak of the last few ice age cycles is dangerously close to the level that will make all multicelled life extinct.
- The current CO2 levels are barely above “CO2 starvation” by plant life and well below the >1200ppm average over the lifetime of multicelled life.
Reasons AGW Claims are Wrong:
- CO2 levels (400ppm) is barely above plant starvation (285ppm) and could cause extinction at the peak glaciation of the upcoming next cycle of the ice age if the CO2 level goes below 150 ppm, the point where photosynthesis shuts down. This IS an existential threat!
The Troposphere is a Heat Pipe
When I finally understood how the troposphere, a heat pipe came to mind as I’ve often used them to cool electronics. You probably have never heard of heat pipes, but you likely own one or more as they are commonly used to cool computer CPUs. The adiabatic lapse rate mechanism causes the heat transfer that cools the CPU just as it cools the earth’s surface. Figure 8 illustrates the concept.

Figure 8. Diagram illustrating vaporization, adiabatic lapse rate, and condensation heat release that performs heat-pipe and troposphere heat transfer.
Both the troposphere and the heat pipe rely heavily on latent heat (phase changes) to increase heat transfer efficiency. However, I am aware of no other heat pipe that utilizes IR radiation as its heat sink.
The scientific community should replace the “greenhouse gas” metaphor with the term heat-pipe IMO. “Greenhouse gas” is an oxymoron because a greenhouse traps heat in a location by eliminating convection, while a gas helps heat move due to its motion. A heat pipe is analogous to our atmosphere because it utilizes the gas law, along with the adiabatic corollary, as the mechanism for transferring heat.
The Adiabatic Corollary Applied to the Troposphere
I include the following equations to validate the gas law’s truth and accuracy, with the adiabatic corollary being the mechanism that controls the earth’s surface temperature. You do not need to understand them.23 I include them to prove that known, understood scientific principles, properly applied, accurately account for Earth and Venus’s lower atmosphere temperatures and pressures.
Equation 2. The Gas Law Adaibiac temperature/pressure relationship
The gas temperature, T, is always proportional to the gas pressure p, to the adiabatic exponent’s power, which depends upon the gas mixture’s effective heat capacity.24
From this adiabatic relationship, plus the Stefan-Boltzmann black body radiation equation, the following equation was derived. One can follow the derivation of the equation below on pages 32 – 42 in the Evolution of Climate book.
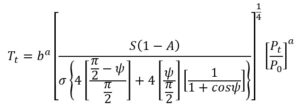 Equation 3 The tropospheric temperature, as a function of the pressure at any altitude (Pt), precession (y) and cloud feedback (b) This is equation 2.25 of the Evolution of Climate book, page 46.25
This equation provides the relationship between temperature and pressure from ground level (Pt = P0 = 14.7 lbs/in2) to the top of the troposphere. Equation 2.526 establishes the TOA (Top Of Atmosphere), where the heat energy transported from the Earth’s surface radiates to the cosmos.
The mass of the atmosphere, the earth’s gravity (1g), and the earth’s surface area determine the pressure at the earth’s surface.27
Therefore, the parameters in Equation 3 defines the earth’s surface temperature, and they are:
- P0, the pressure at the Earth’s surface determined by the mass of the atmosphere, earth’s gravity and surface area,
- b, The cloud cover feedback scaling factor,
- a, The adiabatic exponent, derived from the atmosphere’s adiabatic specific heat as defined by Equation 2.
- S, the solar constant that defines the energy received from the sun,
- A, albedo that establishes the amount of sun’s energy reflected by the earth,
- y, the earth’s precession angle.

Figure 9. Correlation of measured temperature vs. altitude for the Earth and Venus to the computed values from equation three above. Note the correlation is better than line width for the Earth’s total troposphere and almost as accurate for half of Venus’s atmosphere. This figure is from The Evolution of Climate book, page 42.
QED, this comparison validates the gas law, with the adiabatic corollary being the mechanism determining the Earth’s surface temperature. Accordingly, if CO2 replaced all of the Earth’s air, this mechanism predicts, without changing the H2O profile, the surface temperature would decrease around 7 degrees C.28
So far, we’ve been talking about the averages. The centrifugal force or the earth’s rotation, the moon and sun’s gravitational pull, and the centrifugal force due to the moon’s orbit around the earth all create some surface pressure variations. A more significant issue is the temperature at the earth’s surface. We know it varies dramatically, caused mainly by the sun’s heat energy’s uneven application between the poles and the equator and the earth’s rotation axis’s tilt. And there is day and night. How can one know what the average temperatures, pressures, CO2 concentrations, etc., are when there are dramatic variations that exist at any point in time and place on earth?
- Scientists have successfully formulated and verified the gas law with the adiabatic gas corollary determines the Earth’s temperature as a function of the Earth’s mass, diameter, the atmosphere’s mass, atmosphere gasses’ relative amounts, molecular weights, and specific heats.
- The gas optical (“greenhouse”) properties will impact the weather required to set the temperature, but not the temperature itself.
- Increasing CO2 will have a minor impact on surface temperature, but increases in CO2 level will slightly lower the temperature because of CO2’s atomic weight and specific heat.
Reasons AGW Claims are Wrong:
- Scientists have conclusively demonstrated the Gas Law with the adiabatic corollary to be the mechanism that determines the Earth’s surface temperature, not “greenhouse” gasses coupled with an invented CO2 “forcing mechanism.”
Suggested Study
Scientists
Roy Spencer
Roy Warren Spencer is a meteorologist, a principal research scientist at the University of Alabama in Huntsville, and the U.S. Science Team leader for the Advanced Microwave Scanning Radiometer on NASA’s Aqua satellite. In addition, he has served as senior scientist for climate studies at NASA’s Marshall Space Flight Center. NASA awarded him the Exceptional Scientific Achievement Medal and AMS Special Award. Check out these few pages of Climate Confusion, plus his excellent website with tons of information and links to his other books.
Video: Global warming not as big an issue as scientists predicted, 2015, 4 minutes
video: Climate Change, 2009, 51 minutes
William Happer
William Happer is an American physicist who has specialized in the study of atomic physics, optics, and spectroscopy. He is the Cyrus Fogg Brackett Professor of Physics, Emeritus at Princeton University and a long-term member of the JASON advisory group, where he pioneered the development of adaptive optics.
Organization founded: CO2 Coalition
Books: Optical Pumping: Principles and Applications, Optically Pumped Atoms
Awards: Sloan Research Fellowship, Davisson–Germer Prize in Atomic or Surface Physics
Education: Princeton University (1964), University of North Carolina at Chapel Hill (1960)
Video: He rebuts the myth of carbon pollution, 2018, 50 min. This video briefly touches on most of the technical issues I cover in this post.
Video: Can Climate Models Predict Climate Change? PragerU, 5 min.
Dan Britt
Dr. Daniel Britt is a Professor of Astronomy and Planetary Sciences at the Department of Physics, University of Central Florida. He was educated at the University of Washington and Brown University, receiving a Ph.D. from Brown in 1991. He has had a varied career, including service in the U.S. Air Force as an ICBM missile launch officer and an economist for Boeing before going into planetary sciences. He has served on the science teams of two NASA missions, Mars Pathfinder and Deep Space 1. He was the project manager for the camera on Mars Pathfinder and has built hardware for all the NASA Mars landers. He currently researches the physical properties and mineralogy of asteroids, comets, the Moon, and Mars under several NASA grants. He is the Center for Lunar and Asteroid Surface Science (CLASS) director, a node of NASA’s Solar System Exploration Research Virtual Institute (SSERVI). In addition, he has served as the Chair of the Division for Planetary Sciences of the American Astronomical Society and the Planetary Geology Division of the Geological Society of America. Honors include 6 NASA Achievement Awards, election as a Fellow of the Meteoritical Society, and an asteroid named after him; 4395 DanBritt.
Video: This video provides why many today suspect it to be the mechanism causing the ice age we are in now, 55 min.
Richard Lindzen
Richard Lindzen is a dynamical meteorologist interested in the broad topics of climate, planetary waves, monsoon meteorology, planetary atmospheres, and hydrodynamic instability. His research involves studies of the role of the tropics in mid-latitude weather and global heat transport, the moisture budget and its role in global change, the origins of ice ages, seasonal effects in atmospheric transport, stratospheric waves, and the observational determination of climate sensitivity. He has published more than 200 scientific papers and books. From 1983, when he joined the faculty at MIT until he retired in 2013, he was Alfred P. Sloan Professor of Meteorology. Here is his CV that lists his almost 300 publications and several books.
Video: Climate-change: what do scientists say? 5 minurwa.
Patrick Moore
Dr. Patrick Moore has been a leader in the international environmental field for over 30 years. He is a founding member of Greenpeace and served for nine years as President of Greenpeace Canada and seven years as a Director of Greenpeace International. As the leader of many campaigns, Dr. Moore was a driving force shaping policy and direction, while Greenpeace became the world’s largest environmental activist organization.
In recent years, Dr. Moore focused on the promotion of sustainability and consensus building among competing concerns. He was a member of the British Columbia government-appointed Round Table on the Environment and Economy from 1990 – 1994. In 1990, Dr. Moore founded and chaired the B.C. Carbon Project, a group that worked to develop a common understanding of climate change.
Dr. Moore served for four years as Vice President, Environment for Waterfurnace International, the largest manufacturer of geothermal heat pumps for residential heating and cooling with renewable earth energy.
As Chair of the Sustainable Forestry Committee of the Forest Alliance of B.C., he leads the process of developing the “Principles of Sustainable Forestry,” which a majority of the industry has adopted.
In 1991 Dr. Moore founded Greenspirit, a consultancy focusing on environmental policy and communications in natural resources, biodiversity, energy, and climate change
In 2000, Dr. Moore published Green Spirit – Trees are the Answer, a photo book that provides new insight into how forests work and how they can play a decisive role in solving many of our current environmental problems.
- Ford Foundation Fellowship, 1969-1972
- Ph.D. in Ecology, Institute of Resource Ecology, University of British Columbia, 1972
- Honours B.Sc. in Forest Biology, University of British Columbia
Here is a more detailed bibliography
Since time immemorial, our climate has been and will constantly be changing. Patrick Moore (co-founder of Green Peace) explains why “climate change,” far from being a recent human-caused disaster, is a fact of life on Planet Earth for a myriad of complex reasons.
Video: What they haven’t told you about Climate Change, PragerU, 5 min.
https://www.prageru.com/video/what-science-reveals-about-climate-change
YouTube has blocked this video?
Video: The Truth about CO2, PragerU, 5 min.
Books
“The Greatest Hoax, How the Global Warming Conspiracy Threatens Your Future” by Senator Inhofe
Senator Inhofe exposed what became known as “Climate Gate.” The book reveals the communications between the members of IPCC (Intergovernmental Panel on Climate Change) that documented the cherry-picking of information to support the narrative of global disaster. Remember the “hockey stick” their model predicted? As time passed, it was apparent that the hockey stick was not going to occur, so “global warming” became “climate change.” And now-available satellite temperature data have tempered their exaggerated temperature rise claims. This book looks at the human side of the issue, heavily looking at the motivation powering the movement. As the cover says, “Senator James Inhofe reveals the reasons behind those perpetuating the Hoax of global warming, who is benefitting from the general acceptance of the Hoax and why the premise statements are blatantly and categorically false.”
“Miracle Molecule, Carbon Dioxide Gas of Life” by Paul Driessen
This book is a short read (40 pages) and well worth it—the astonishing story of a simple chemical that made life on Earth possible and continues its work today. Tiny amounts of this miracle molecule not only make life on Earth possible, but rising atmospheric CO2 levels also spur forest and crop growth, help plants survive heat and drought, and feed the world.
“The Rational Climate e-Book, Cooler is Riskier, The Sorry State of Climate Science and Policies,” December 22nd, Poyet, P., 2020. 114 Figures, 176 Equations, 430 pp., e-ISBN 978-99957-1-929-6.
Patrice Poyet: “I graduated in Geophysics, Geochemistry and Remote Sensing with a DEA from Ecole des Mines de Paris / CTAMN (1982) – First in my class (“Mention Très Bien”, i.e. grade point average > 18/20). I defended a D.Sc. in Geochemistry, Geo-Mathematics and Geo-Informatics (1986) at Nice University and INRIA (National Research Institute in Computer Science and Automation) – “Mention très honorable et félicitations du jury”. I have an interest in various domains like Earth and Planetary Sciences, Astronomy, Finance and Trading, Integration in Manufacturing and Design, Simulation and Defense Systems, etc. I published 38 articles mostly in peer-reviewed scientific journals, 6 books jointly-reviewed with colleagues, 6 peer-reviewed chapters in books, 64 papers in peer-reviewed conferences, one D.Sc. thesis (1986), and 32 scientific and technical reports for demanding public and private clients and acted as an expert reviewer for several EC R&D projects. I am now using my initial training and my passion for Earth and Space sciences to completely revisit the subject of climate and paleo-climates. The result is this free 473 pages e-Book that addresses all aspects of the subject.”
This book is a mammoth effort covering all aspects of the topic. Chapter 2 is the science, roughly half of the book, Chapter 3 is about the computer models, Chapter 4, Policies, Chapter 5, Conclusions. There are 70 pages of references.
One can appreciate the 70 pages of references because most of the book is actually quotes. The first part of section 4.3 Hidden Agenda reads:
“No matter if the science (of global warming) is all phony. Climate change (provides) the greatest opportunity to know about justice and equality in the world. It’s a great way to redistribute wealth”, Christine Stewart, Canadian Minister of the Environment, Calgary Herald, 1998
From what has been explained in the previous section, none should be surprised of the existence of a hidden agenda. While the global warming alarmists have done a good job of spreading fright, they haven’t been so good at hiding their real motivation. We have been told now for almost three decades that man has to change his ways or his fossil-fuel emissions will scorch Earth with catastrophic warming. Scientists, politicians and activists have maintained the narrative that their concern is only about caring for our planet and its inhabitants. But this is simply not true. The narrative is a ruse. They are after something entirely different. If they were honest, the climate alarmists would admit that they are not working feverishly to hold down global temperatures — they would acknowledge that they are instead consumed with the goal of holding down capitalism and establishing a global welfare state.
«One has to free oneself from the illusion that international climate policy is environmental policy. This has almost nothing to do with the environmental policy anymore, with problems such as deforestation or the ozone hole. We redistribute de facto the world’s wealth by climate policy» Ottmar Edenhofer342.”
No matter what your area of interest is, download the book. It is free. Then find your topic and read everything ever written about it.
“The Evolution of Earth’s Climate” by J.O Robertson, G.V. Chilingar, et al., June 2018, John Wiley & Sons, Inc. This book is also free online at ClimateCite.com. The engineer/physicist will appreciate this book. It develops the adiabatic theory and the math presented in this post that correlates the theory with measured data on Earth and Venus. Unfortunately (for them), the climate alarmist have no equivalent validation of their theory; they only have failed computer models.
The book focuses on the physics that determines the temperature/pressure profile of the atmosphere. However, their website is a different story. Therefore, I suggest one take the tutorial (Climate Facts on main menu) and browse the rest of the site.